
Hefei China, November 18, 2026 -- A test of a 10-millimeter printed circuit board illustrates how high-speed imaging and digital image correlation can help engineers examine a board's response to vibration and mechanical shock, according to a Revealer technical case study.
The PCB vibration and shock test used a Revealer NEO 25M high-speed camera to record a speckled board surface. High-speed digital image correlation, or DIC, then extracted displacement and strain information from the images. The combination provided a way to connect recorded motion with measurements across a selected area of the board.
The case study reports three response spectral peaks during a sweep from 50 to 2,000 hertz, close agreement with reference sensor frequencies, and a sharp acceleration peak followed by further oscillations during mechanical shock. Those observations show why engineers examining electronic assemblies may need to look at both the largest response and how the board behaves afterward.
Capturing a PCB vibration and shock test
The imaging setup included a 100-millimeter lens and two 220-watt light sources. A vibration table supplied swept-frequency and fixed-frequency loading, while a shock table generated the short mechanical event.
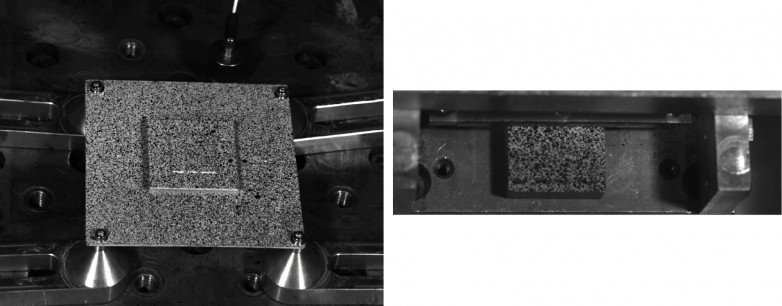
For fixed-frequency vibration, the high-speed camera recorded 1280 × 1024-pixel images at 20,000 frames per second, giving an interval of 50 microseconds between frames. For shock testing, the field was windowed to 896 × 288 pixels at 80,000 frames per second, reducing the interval to 12.5 microseconds.
That change increased the number of images available over a given time interval while reducing the visible area. The case study emphasizes keeping the target speckles in view throughout the shock.
Speckle images of the PCB during fixed-frequency vibration (left) and through the window used for mechanical shock recording (right). The test used a Revealer NEO 25M high-speed camera. Image from the Revealer technical case study.
Reading the vibration response
The swept-frequency analysis identified response peaks at 226.5, 902 and 938.5 hertz. Each peak frequency differed from the reference sensor result by no more than 1 hertz, the case study reports. The lowest marked peak was the most prominent, and the two higher peaks were separated by 36.5 hertz.
At a fixed excitation frequency of 225 hertz, high-speed DIC found a dominant response at the same frequency. The acceleration record contained about 45 cycles over 0.20 seconds, consistent with a period of approximately 4.44 milliseconds.
Smaller spectral peaks appeared near 450, 675 and 900 hertz, close to integer multiples of the excitation frequency. The case study identifies the proximity of the 902-hertz swept-frequency peak to the approximately 900-hertz fixed-frequency peak as a reason to examine input harmonics, fixture behavior and the board's response.
Confirming a structural mode requires closer examination of the response. The study proposes additional sweeps near the marked frequencies, comparison of board response with table input, and checks of the spatial response. Amplitude and phase information help engineers interpret what produced a spectral peak.
Following the board after the main shock peak
In the shock record, mean acceleration along the Z axis rose sharply near 3 milliseconds on the displayed time axis. Several positive secondary peaks and negative troughs followed through approximately 4.1 milliseconds. The prominent positive secondary peaks were roughly one-quarter to less than one-half of the main peak.
The case study interprets the alternating response as consistent with oscillation of the board–fixture system after excitation. Comparing table acceleration, the recorded images and displacement at several board locations would help distinguish board motion from fixture response or secondary contact.
For the 10,000 g setpoint, the study reports a peak mean Z-axis acceleration of 10,032 g in the DIC analysis region, 32 g above the setpoint, or a relative difference of 0.32%. The comparison uses the shock setpoint as its reference. The study also reports transient changes in maximum principal strain and Z-axis displacement.
The DIC acceleration curve represents the average within the selected measurement region. Assessing local bending requires displacement and phase information at multiple points. That distinction matters when engineers investigate how deformation varies across a board or near a component.
For component reliability work, the practical value of a high-speed camera lies in preserving the sequence of motion. High-speed DIC adds measurements that can be compared across time and position. Engineers can align those records with electrical tests and inspections before and after loading to decide which regions need closer examination.
The Revealer NEO 25M case study presents that workflow as a basis for comparing board designs under matched test conditions. Connecting the images, measured response and inspection findings can give engineers a clearer basis for structural changes and subsequent verification.
Contact Info:
Name: Harrison Shawn
Email: Send Email
Organization: HF Agile Device Co., Ltd.
Website: http://www.revealerhighspeed.com
Release ID: 89209996
If you detect any issues, problems, or errors in this press release content, kindly contact error@releasecontact.com to notify us (it is important to note that this email is the authorized channel for such matters, sending multiple emails to multiple addresses does not necessarily help expedite your request). We will respond and rectify the situation in the next 8 hours.
Source: MarketersMedia




Leave a comment
Comments are closed on this post.